How to Use Expense Insights in PocketGuard (Categories & Merchants)
The Insights section in PocketGuard helps you analyze your expenses and understand your spending habits. It shows how you spend money and helps you stay on budget.
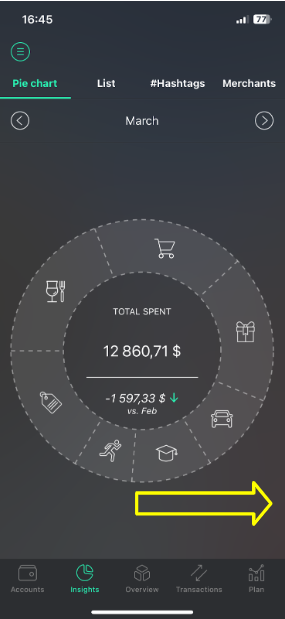
Pie-chart
The pie chart shows your expenses for the current month divided by categories.
- Each purchase is automatically assigned to a category
- Refunds and reimbursements are included in category totals
- Example: If you spend $1000 on Shopping and get $300 refunded, the chart will show $700
Note:
“Other categories” includes categories where spending is less than 5% of your total expenses.
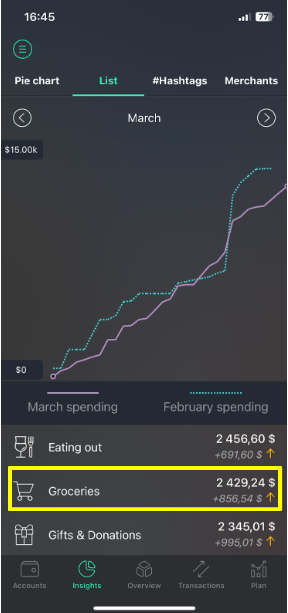
List
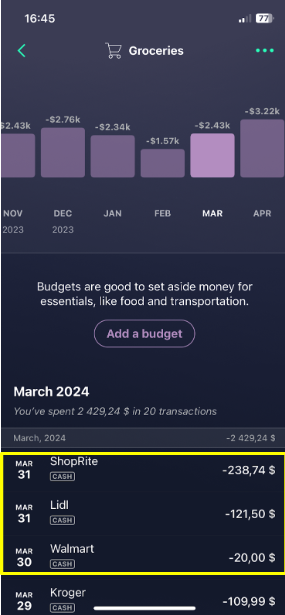
The List tab shows your spending trend and a list of categories with total amounts.
- The chart shows your spending trend
- The list shows total spending per category
- The arrow indicates how much more or less you spent compared to the previous month
To see transactions by category:
- Open the List tab
- Tap a category to view its transactions
#Hashtags
Add hashtags to transaction notes to track your spending in more detail.
- Use #hashtags in notes
- View all hashtags you have used
- Tap a hashtag to see a graph and total balance
Read more about #hashtags HERE.
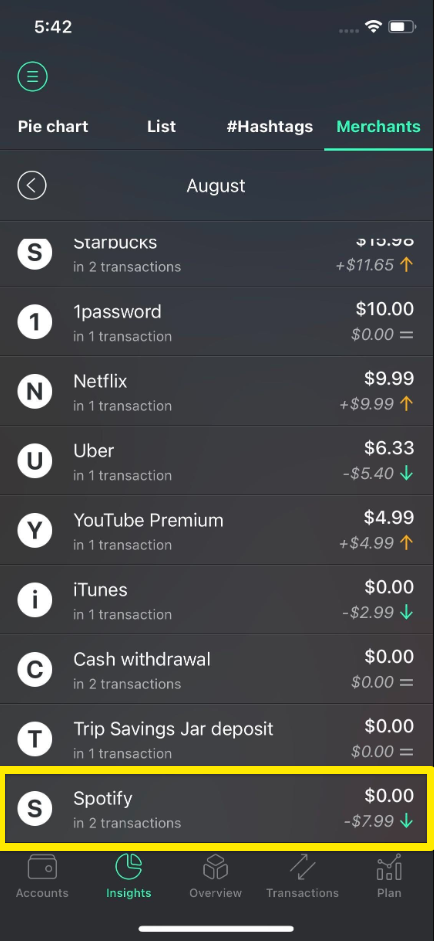
Top-Merchants
The Top Merchants feature helps you analyze your spending by merchant name.
- Track how much you spend by merchant
- See your top 10 merchants in a chart
- Understand where your money goes
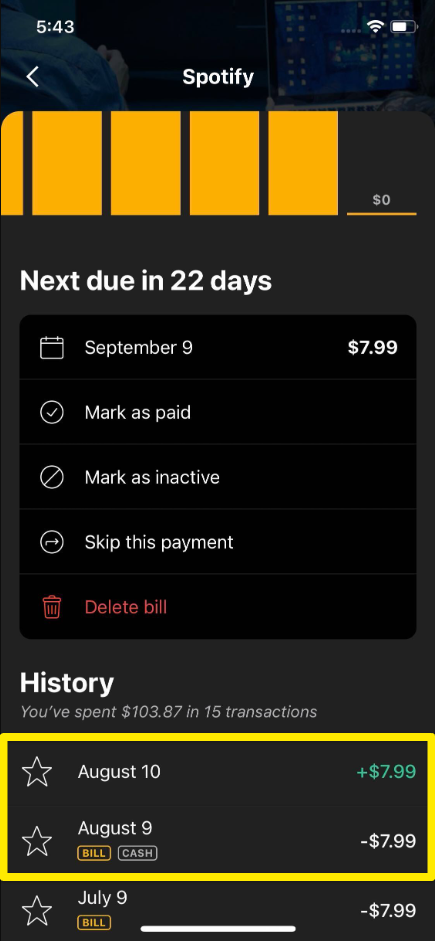
Why does a merchant equal zero?
A merchant may show $0 spending if:
- You received a refund for the same amount you spent
- You receive income from the same merchant you also spend money with (for example, Amazon or PayPal)
In these cases, the amounts offset each other.
If you have any questions, please contact our support team.