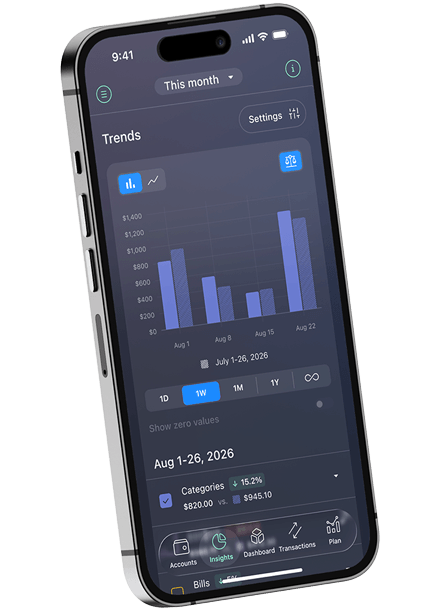
Your money tells a story. Insights helps you read it — with visual reports that show where your money goes, how your habits change over time, and whether your spending actually matches your plan. Available on iOS first, with the Android rollout coming soon.
Trusted by budgeters:
Insights turns your transaction history into reports you can actually learn from. Pick what you want to analyze, set your time range, and get the answer — no manual work needed.
Use quick presets like This Month, Last 7 Days, or Year to Date, or set a custom range when you need something specific.
Track your expenses, your paychecks, or your credit transactions — whatever question you're trying to answer.
Group your data by category, budget, bill, merchant, or hashtag, and pick more than one at a time for a fuller picture.
Bar is great for comparing amounts, line is better for watching a trend unfold. Switch anytime without losing your setup.
Group your chart by day, week, month, or year. Available options adjust automatically based on the date range you picked.
Turn on period comparison to put this month next to last month or any two equal stretches of time right on the same chart.

Trends is just the start
Comparisons, a full custom table, and more ways to break down your data are coming to Insights soon.
Start your free trialCancel anytime